A Comprehensive Guide to Elliott Wave
Elliott Wave Analysis Demystified
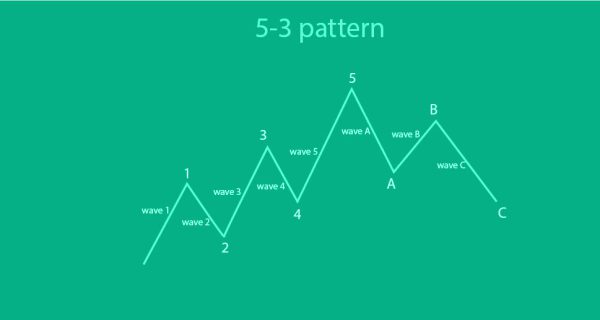
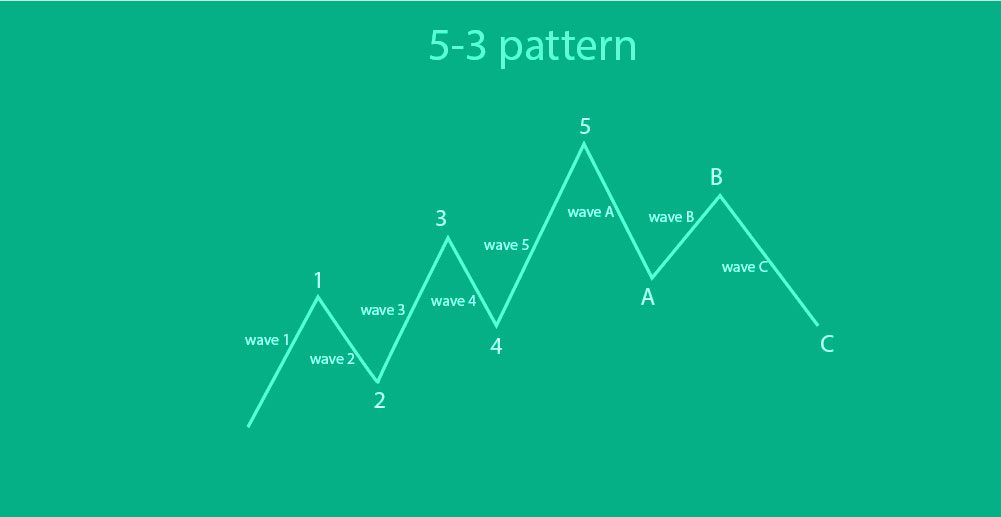
A fascinating branch of technical analysis, Elliott Waves, is born from the fusion of recurring price patterns and Fibonacci analysis. Ralph Nelson Elliott, the mastermind behind this concept, dedicated 75 years of stock data analysis to create his ground-breaking work, ‘The Wave Principle.’ He proved that price movements weren’t purely random; markets followed repetitive cycles. Elliott attributed these price swings to the collective psychology of traders, particularly their emotions. His book outlined strategies for capturing ideal price trends, methods for seizing market corrections, and continuations. Among the fundamental wave patterns is the 5-3 pattern – five impulse waves followed by three corrective waves.

The initial wave marks the onset of an upward (or downward in a downtrend) move. Triggered by a sudden influx of buyers (or sellers), the price embarks on a significant rally (or selloff). The second wave unfolds in the opposite direction as traders either pocket profits near a crucial point or perceive the asset or currency pair as overvalued (or undervalued). Consequently, it triggers a move in the reverse direction, but it doesn’t surpass the initial price before the first wave commenced. The third wave arrives when more buyers (or sellers) recognize the asset’s powerful trend, providing them with an opportunity to join at an advantageous price. As a result, they place their long (or short) orders, further driving up (or down) the price. The fourth wave emerges as traders once again contemplate the asset’s overvaluation and decide it’s time to book profits. The fifth and final wave extends the price rally to an extreme point of overvaluation (or undervaluation) before the trend reverses. The first, third, or fifth impulse waves could be extended, depending on market psychology and sentiment. Fundamental and technical factors might also combine to influence price action.
What makes Elliott Waves particularly intriguing is that these impulse and corrective waves are visible in longer-term timeframes as well as in much shorter ones like the 1-minute chart. According to Elliott, there are approximately 21 wave patterns illustrating this phenomenon, each showcasing various degrees of wave strength, sharpness, or shallowness of pullbacks. These can manifest as zig-zags, flat formations, or triangle patterns, all exhibiting a similar appearance to the 5-3 wave pattern. Crucially, Elliott Waves adhere to three cardinal rules: The third wave can never be the shortest impulse wave, the second wave can never exceed the beginning of the first wave, and the fourth wave can never overlap with the first wave.
Ready to explore the fascinating world of Elliott Waves and enhance your trading strategies? Connect with MarkUP Trade for valuable insights and expert guidance. Discover how to elevate your trading skills and benefit from this intriguing analysis method. Get started on your trading journey with MarkUP Trade today!

