Decoding Japanese Candlestick Analysis
Unveiling the Essence of Japanese Candlestick Analysis
The roots of candlestick charting trace back to 17th-century Japanese rice traders, particularly Munehisa Homma. Initially developed to monitor daily shifts in rice prices, this technique became a pivotal decision-making tool for traders in buying or selling commodities. Steve Nison, a renowned advocate of candlestick patterns, later enhanced and compiled these methods, publishing ‘Japanese Candlestick Charting Techniques’ in the early 90s.
In the context of forex price action, candlestick charts offer a unique advantage by providing a visual representation of buying and selling pressure. A swift glance at these charts reveals whether bulls or bears dominate, aiding in predicting potential reversals or trend continuations.

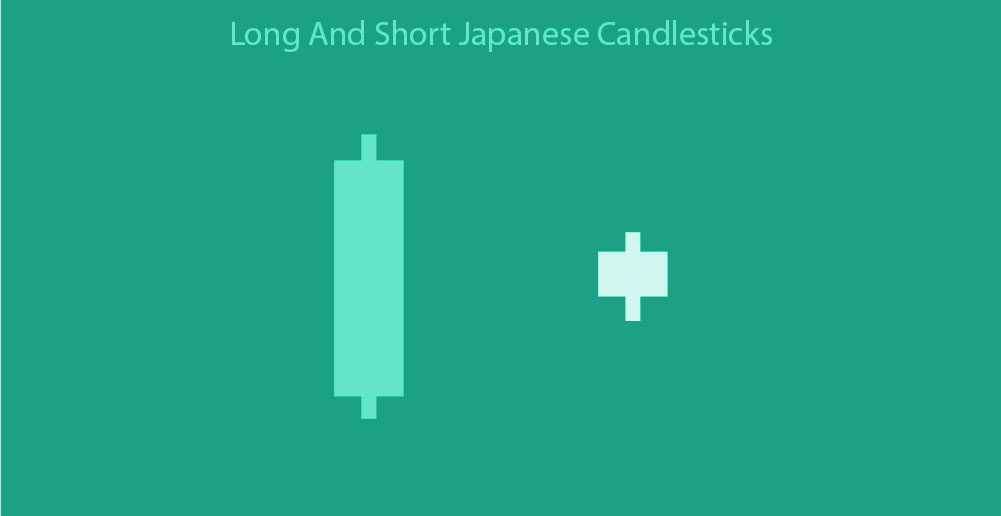
Beyond this, the open and close levels of longer-term charts (e.g., daily and weekly) act as crucial support or resistance for intraday price dynamics. Japanese candlestick patterns mark these levels, while the highs and lows act as indicators for breakout moments. Candlestick length also serves as a gauge for market behavior, with long green candles indicating aggressive buying and long red candles signaling persistent selling. Short candles often suggest indecision or hint at an impending market reversal.

The shadows or wicks of candlesticks, representing highs and lows, provide additional insights into future price movements. For instance, a candlestick with a long upper wick and short lower wick indicates buyers pushing prices higher, met with firm resistance from sellers. Conversely, a candlestick with a long lower wick and short upper wick implies aggressive sellers met with equally determined buyers.
Candlestick patterns come in various forms, from single patterns applicable to both long-term and intraday trading to double patterns signaling reversals or continuations. Group patterns, comprising three candlesticks, are more complex yet more reliable for long-term price movements. Despite the drawbacks of relying solely on candlestick patterns—mostly based on technical signals without economic analysis—they remain valuable for understanding market behavior and enhancing trading profitability.
For more forex insights and effective trading strategies, seek guidance from the expert analysts at MarkUP Trade. Take a step towards success.