logotype
  • HOME
  • ABOUT US
  • TRADING
    • Account Types
    • Trading Instruments
  • NEWS
  • EDUCATION
    • Forex Glossary
    • Forex Trading
    • Technical Analysis
  • PARTNERSHIP
  • CONTACT US
LOGIN
  • HOME
  • ABOUT US
  • TRADING
    • Account Types
    • Trading Instruments
  • NEWS
  • EDUCATION
    • Forex Glossary
    • Forex Trading
    • Technical Analysis
  • PARTNERSHIP
  • CONTACT US

MarkUP Trade

MarkUP Trade

  • HOME
  • ABOUT US
  • TRADING
    • Account Types
    • Trading Instruments
  • NEWS
  • EDUCATION
    • Forex Glossary
    • Forex Trading
    • Technical Analysis
  • PARTNERSHIP
  • CONTACT US

Foundations of Forex Chart Formations

September 1, 2023

Mastering Chart Formations

Unlocking the Power of Chart Formations in Technical Analysis: Beyond technical indicators and Japanese candlestick patterns, chart formations play a pivotal role. Technical analysis is built on the premise that price patterns tend to replicate, providing valuable insights into future price behavior. While the numerous classic chart formations may initially appear overwhelming, familiarity comes with practice. Often, the names of these formations aptly describe their appearance on charts. Take, for example, the easily recognizable double top and double bottom patterns, which resemble twin peaks and troughs in price action.
ic-charts-4-17

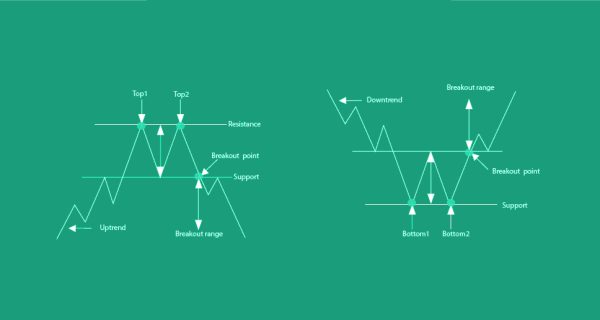
Double top and double bottom

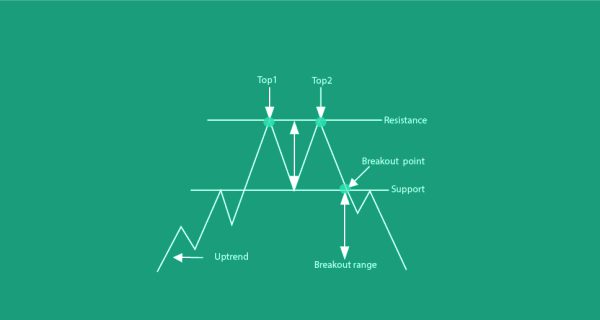
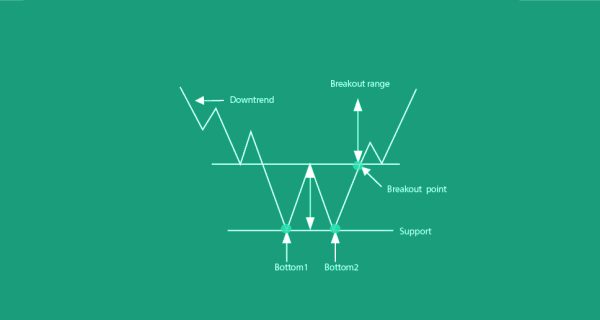
These serve as reversal indicators, indicating the potential start of a fresh trend when the neckline is breached. In such cases, you can place a buy order above the double bottom’s neckline or a sell order below the double top’s neckline.
ic-charts-4-18

Double top neckline, entry and resulting selloff

Sketching necklines requires practice, but a useful tip is to draw a horizontal line connecting the price turns between the lows or the highs.
ic-charts-4-19

Double bottom neckline, entry and resulting sellof

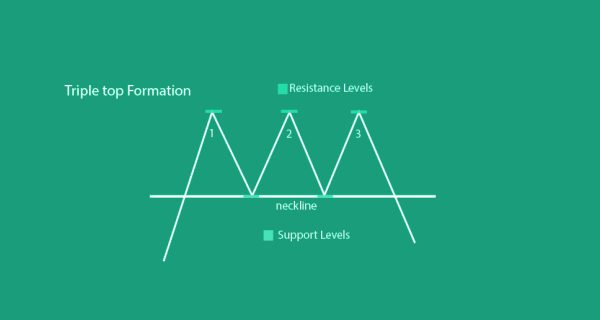
Another form of the double top and double bottom is the triple top and triple bottom, which also serve as reversal indicators. Although they are less common, they can be powerful indicators of a new trend.
ic-charts-4-20

Triple top and triple bottom

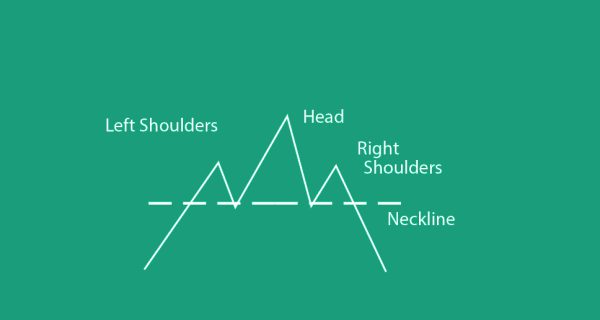
A more intricate reversal pattern is the head and shoulders. If this pattern develops after an uptrend, it can indicate the possibility of a selloff if the price manages to break below the neckline.
ic-charts-4-21

Head and shoulders

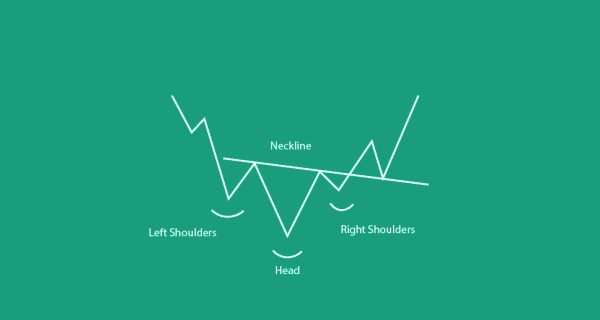
On the contrary, when an inverse head and shoulders pattern emerges at the bottom of a downtrend, it suggests that the price is poised to reverse and potentially enter an uptrend after breaking above the neckline.
ic-charts-4-22

Inverse head and shoulders

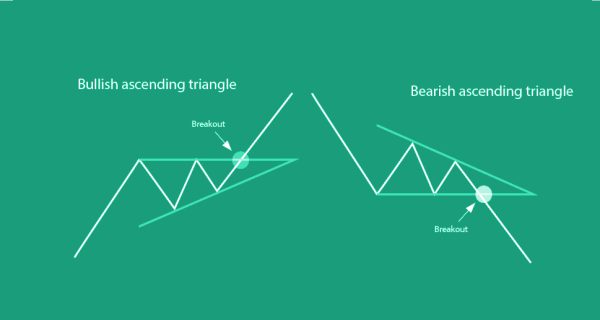
Another category of chart patterns encompasses the triangular formations, which can take the form of descending, ascending, or symmetrical patterns.
ic-charts-4-23

Descending triangle, ascending triangle, symmetrical triangle

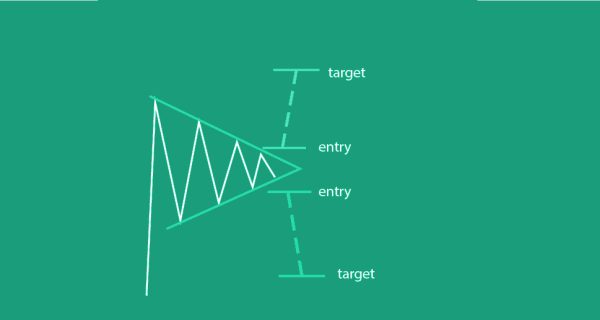
There are no strict rules determining whether these patterns lead to reversals or continuations. When the price consolidates near the apex of the triangle, it often indicates an impending breakout in either direction. Traders aim to capitalize on upward or downward movements by placing buy and sell orders beyond the triangle’s boundaries.
ic-charts-4-24

Symmetrical triangle straddle setup

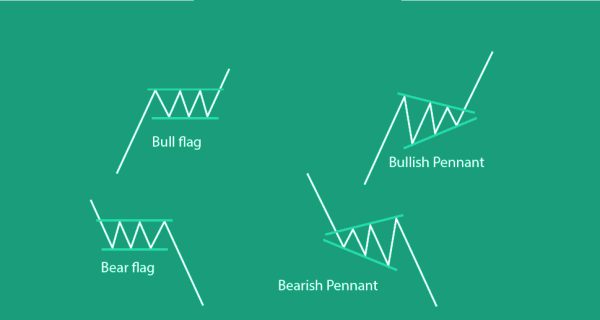
Finally, let’s not forget about another widely recognized category of chart formations known as flags and pennants. These patterns are generally regarded as continuation signals, indicating a brief consolidation period within a flag or pennant before the prevailing trend resumes.
ic-charts-4-25

Flag and pennant

We’ll explore additional chart patterns like wedges and cup-and-handle formations in a forthcoming section.

PREVIOUS

Trendlines and Price Channels in Forex Analysis

NEXT

South Africa's Best Forex Broker: MarkUP Trade

Related Posts

Technical Analysis
August 31, 2023admin

Chart Varieties

READ MORE
Technical Analysis
August 31, 2023admin

Trendlines and Price Channels in Forex Analysis

READ MORE

Comment(01)

  1. Pingback: MarkUP Trade: Analysis Methods

Recent Posts

  • Bitcoin vs. Gold: Which One Has Been More Profitable?
  • Online Stock Trading Tips for Beginners
  • MetaTrader 4 vs MetaTrader 5: Which is Better in 2023?
  • The Significance of Demo Accounts in Testing Trading Strategies
  • How to Trade Forex in South Africa

Recent Comments

  1. MarkUP Trade: Analysis Methods on Foundations of Forex Chart Formations
  2. MarkUP Trade: Mastering Forex Strategies on What Is The Forex Trading?
  3. MarkUP Trade: What Is The Forex Trading? on South Africa’s Best Forex Broker: MarkUP Trade

Archives

  • September 2023
  • August 2023

Categories

  • Clean Tech
  • Commodities
  • Crypto
  • Currencies
  • Forex
  • Forex Trading
  • Indices
  • Stocks
  • Technical Analysis
Categories
  • Clean Tech(1)
  • Commodities(1)
  • Crypto(1)
  • Currencies(1)
  • Forex(6)
  • Forex Trading(6)
  • Indices(1)
  • Stocks(1)
  • Technical Analysis(3)
Popular Tags
amazaon Analysis Methods Bitcoin Bitcoin trading china CleanTech Day Trading Demo Account Benefits Demo Trading Strategies digital dxy euro fed forex Forex Analysis Forex Education Forex Strategies forex trading Forex Trading Guide Gold Gold trading inflation Investing in Stocks iran Learn Forex MaMarkUP Trade Market Analysis MarkUP Trade MetaTrader 4 MetaTrader 5 MT4 vs MT5 oilprice online platform Risk-Free Trading Solar south africa forex South African Investment Stock Market Stock Trading technical analysis Trading Platform Trading Platforms Trading Psychology usd Wind
Keep Informed with Our Latest News and Podcasts

    Flaticon-telegramFacebook-fTwitterFlaticon-instagramLinkedin

    Quick Links

    Home

    Contact Us
    About Us

    Partnership

    Trading

    Privacy Policy

    Latest News

    Education

    Contacts

    MarkupTrade LTD : 43 Great George Street, St.Great George, Roseau, Dominica

    [email protected]

    [email protected]

    Check Our Licence

    Privacy Policy

    Deposit & Return Policy

    AML Policy

    Risk Statement

    Markup Trade LTD regulated by Commonwealth of Dominica with 2023/C0010-0003 License Number. 

    Risk Warning: CFDs and FX are leveraged products that carry a high level of risk to your capital. Trading is not suitable for everyone and may result in you losing substantially more than your initial investment. You do not own, or have any rights to, the underlying assets. You should only trade with money you can afford to lose. Past performance is no guarantee of future performance may be subject to change. The information on this website is general in nature and does not take into account your personal objectives, financial situations or needs.

    We do not provide services on behalf of residents of the USA, Canada and Turkey. All brokerage activities on this website are under the control of Markup Trade LTD